


The Ascending Channel: A Bullish Structure
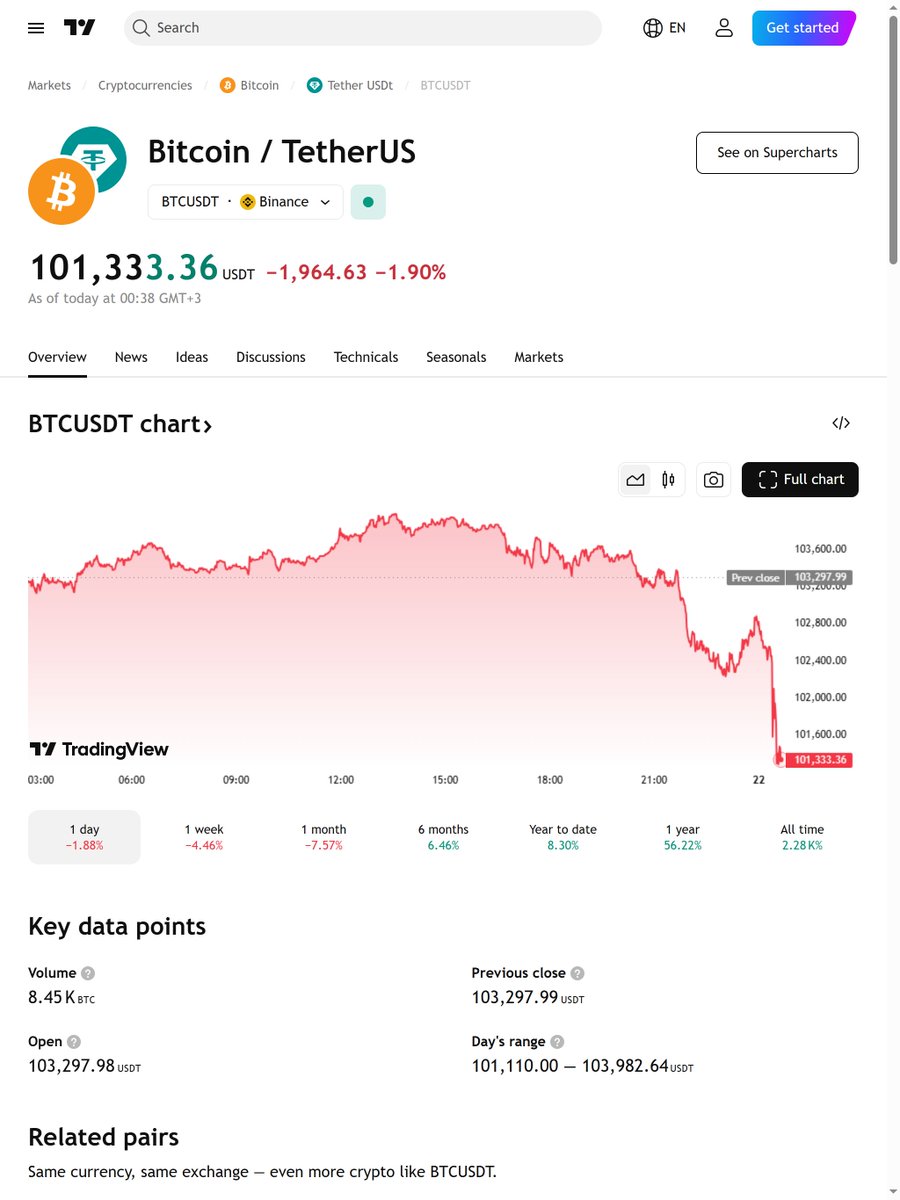
Imagine Bitcoin as a surfer riding a wave. Currently, that wave is an ascending channel that began in early April. This channel is a bullish structure, indicating that Bitcoin is on an upward trajectory. As of May 11, 2025, Bitcoin is trading above $104,000 with a market capitalization of $2.06 trillion. This price movement is closely tracking global liquidity and money supply flows, suggesting that Bitcoin is not just riding a wave but is also influenced by broader economic currents[2].
The ascending channel is a technical pattern that occurs when the price of an asset moves upward within a set of parallel lines. This pattern is typically seen as a bullish indicator, suggesting that the asset’s price is likely to continue rising. In the case of Bitcoin, the ascending channel began in early April 2025, and since then, the price has been steadily climbing within this pattern.
One of the key factors contributing to Bitcoin’s upward trajectory is the increase in global liquidity and money supply. As central banks around the world continue to inject money into their economies, investors are looking for alternative assets to park their funds. Bitcoin, with its decentralized nature and limited supply, has emerged as an attractive option for many investors.
Technical Indicators: A Mixed Bag
Moving Averages
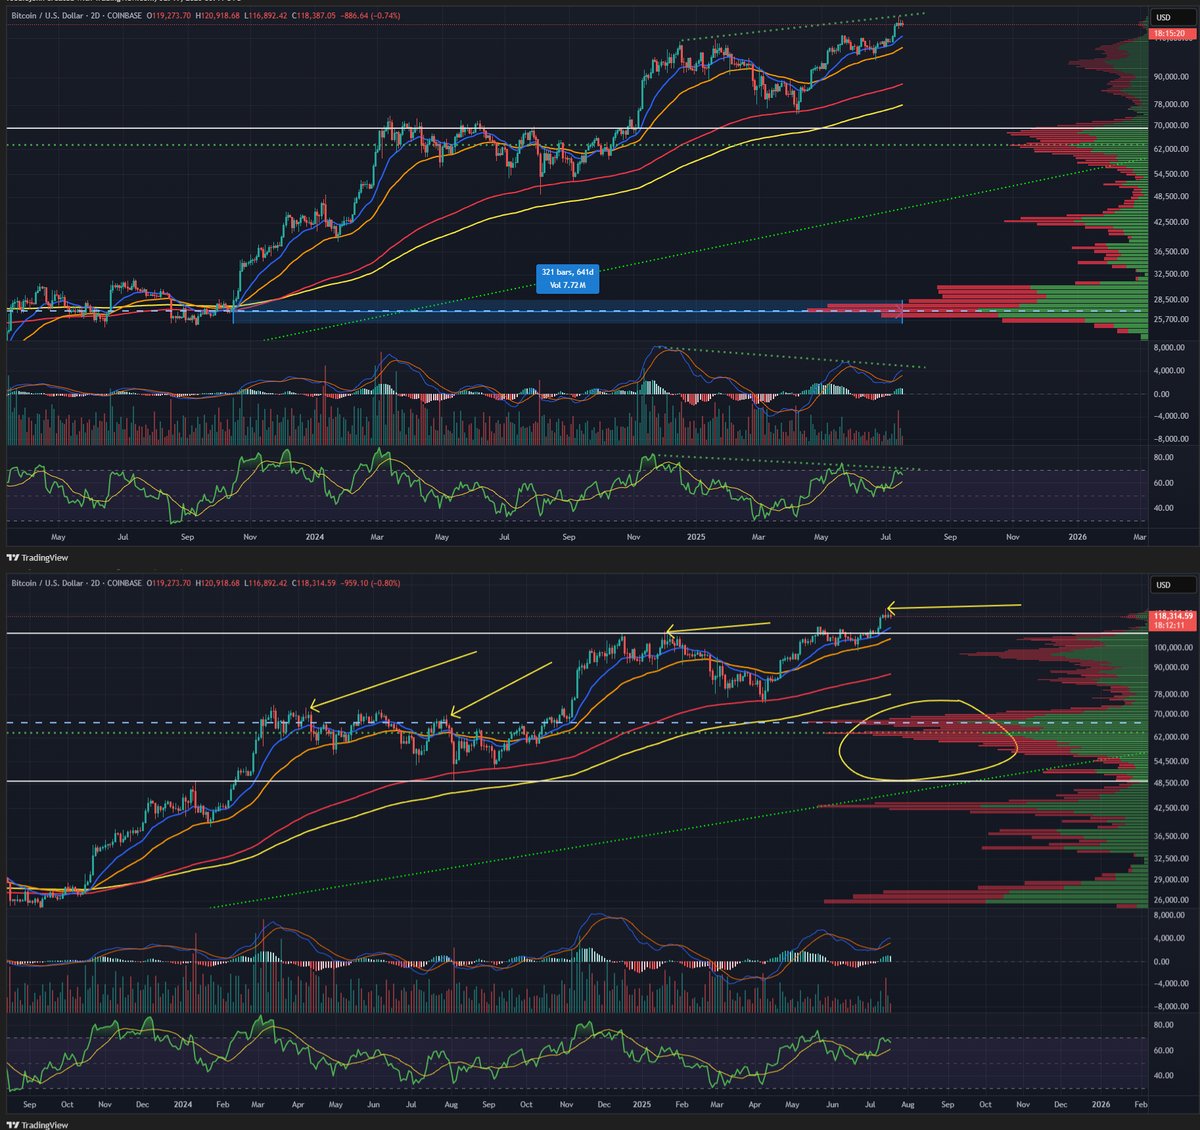
Moving averages are a popular technical indicator used to smooth out price data and identify trends. The 200-day Exponential Moving Average (EMA) is acting as a significant resistance level for Bitcoin. Meanwhile, the 50-day EMA briefly crossed above the 20-day EMA, which is typically a bullish signal. However, the overall trend remains bearish despite short-term fluctuations. This mixed signal from moving averages indicates that while there are bullish signs, the long-term trend is still uncertain[1].
The 200-day EMA is a widely watched indicator that helps traders identify the long-term trend of an asset. When the price of an asset is above the 200-day EMA, it is generally considered to be in an uptrend. Conversely, when the price is below the 200-day EMA, it is considered to be in a downtrend. In the case of Bitcoin, the price has been fluctuating around the 200-day EMA, indicating a lack of clear direction.
Momentum Indicators
On the momentum front, the 5-minute MACD (Moving Average Convergence Divergence) shows a bullish crossover, while the 1-hour chart indicates bullish momentum with RSI (Relative Strength Index) divergence. The 6-hour chart shows the MACD above the signal line, and the 1-day chart indicates a strong uptrend with ATR (Average True Range) expansion. These indicators suggest that Bitcoin has strong short-term and medium-term momentum, but the long-term trend is still under scrutiny[3].
The MACD is a momentum indicator that helps traders identify changes in the strength, direction, momentum, and duration of a trend. When the MACD line crosses above the signal line, it is generally considered a bullish signal. In the case of Bitcoin, the MACD is showing a bullish crossover on the 5-minute and 6-hour charts, indicating strong short-term and medium-term momentum.
The RSI is another momentum indicator that measures the speed and change of price movements. An RSI above 70 is generally considered overbought, while an RSI below 30 is considered oversold. In the case of Bitcoin, the RSI is showing divergence on the 1-hour chart, indicating that the price may be due for a correction.
The Fat-Tail Phenomenon
Bitcoin’s price movements are not always smooth; they often exhibit fat-tail characteristics. An analysis of BTC/USDT 1-hour returns confirmed significant fat-tail characteristics, evidenced by an extremely high excess kurtosis of approximately 14.0. This means that Bitcoin’s price movements are prone to sudden, sharp changes, making it a volatile asset. Traders and investors should be prepared for these abrupt shifts and manage their risks accordingly[9].
The fat-tail phenomenon refers to the tendency of an asset’s price to exhibit extreme movements more frequently than would be expected under a normal distribution. In the case of Bitcoin, the fat-tail phenomenon is evident in the high excess kurtosis of its price returns. This means that Bitcoin’s price is more likely to experience sudden, sharp movements than would be expected under a normal distribution.
For traders and investors, the fat-tail phenomenon presents both opportunities and risks. On the one hand, the potential for sudden price movements can lead to significant profits. On the other hand, the same volatility can also lead to significant losses. As such, it is important for traders and investors to manage their risks carefully and be prepared for abrupt shifts in the market.
The Decentralization Dilemma
Bitcoin’s decentralization is a cornerstone of its value proposition, but recent analyses suggest that it is at risk. A decade-long study by Fenz Labs reveals that Bitcoin node participation strongly correlates with price cycles, threatening network security during bear markets. As the blockchain size has ballooned to 5450GB in 2024, the risks of 51% attacks and regional vulnerabilities have increased. This decentralization dilemma is a critical issue that could impact Bitcoin’s long-term viability and security[REF]5,6[/REF].
Decentralization is one of the key features that sets Bitcoin apart from traditional currencies. By decentralizing the control of the currency, Bitcoin aims to create a more secure and transparent system. However, recent analyses suggest that Bitcoin’s decentralization may be at risk.
One of the key factors contributing to this risk is the correlation between Bitcoin node participation and price cycles. As the price of Bitcoin rises, more nodes are added to the network, increasing its security. However, during bear markets, node participation tends to decline, leaving the network more vulnerable to attacks.
Another factor contributing to the decentralization dilemma is the increasing size of the blockchain. As more transactions are added to the blockchain, its size continues to grow, making it more difficult for individual users to run a full node. This could lead to a concentration of nodes in certain regions, increasing the risk of regional vulnerabilities and 51% attacks.
The Altcoin Season: A Brewing Storm
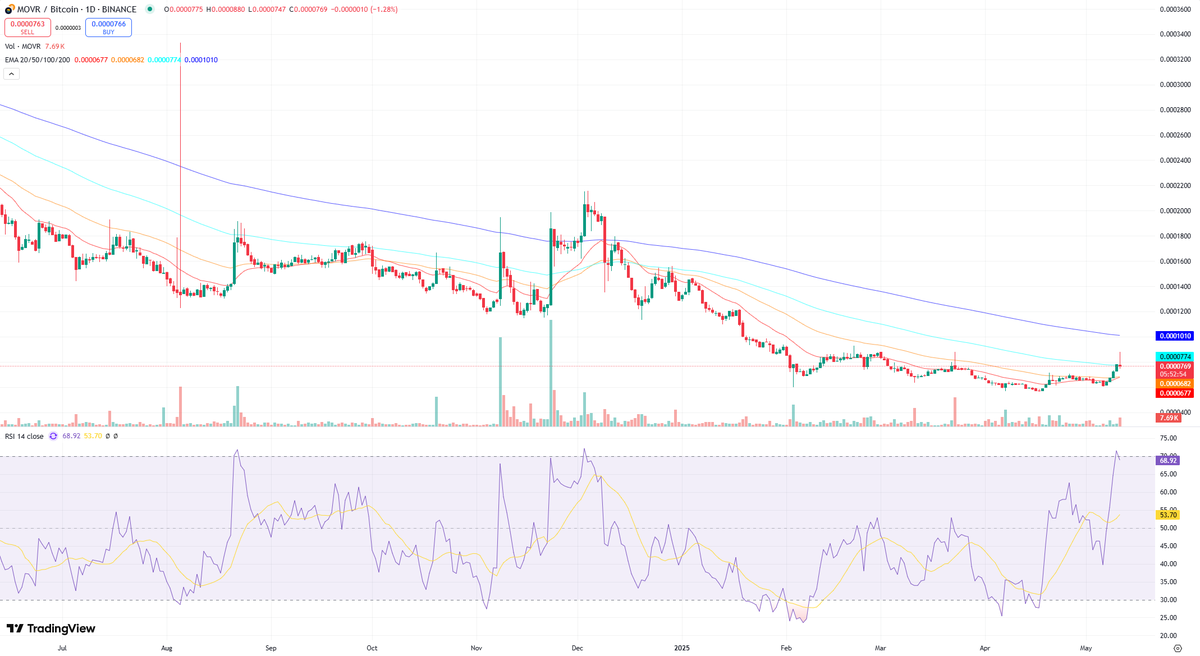
While Bitcoin is making waves, the altcoin market is also showing signs of life. The crypto market has added $248.64 billion in the last 24 hours, indicating that an altcoin season might be on the horizon. This influx of capital into the altcoin market could provide new opportunities for traders and investors, but it also comes with increased risk. As the saying goes, “When the tide rises, all boats are lifted, but when it falls, not all boats float.”[8].
The altcoin season refers to a period when the prices of altcoins (cryptocurrencies other than Bitcoin) tend to outperform Bitcoin. This phenomenon is often driven by increased investor interest and speculation in the altcoin market. In the case of the current crypto market, the influx of $248.64 billion in the last 24 hours suggests that an altcoin season may be on the horizon.
For traders and investors, the altcoin season presents both opportunities and risks. On the one hand, the potential for significant gains in the altcoin market can be enticing. On the other hand, the increased volatility and speculation in the market can also lead to significant losses. As such, it is important for traders and investors to carefully evaluate the risks and opportunities in the altcoin market.
The Strategic Bitcoin Reserve: A Bold Proposal
In a surprising turn of events, UFC champion Conor McGregor has called on Ireland to create a strategic Bitcoin reserve. McGregor argues that an Irish Bitcoin strategic reserve will give power to the people’s money, highlighting the growing interest in Bitcoin as a national reserve asset. This proposal, if implemented, could have significant implications for Bitcoin’s adoption and acceptance as a mainstream asset[17].
The concept of a strategic Bitcoin reserve refers to the idea of a country holding Bitcoin as part of its national reserves. This proposal is significant because it represents a shift in the perception of Bitcoin from a speculative asset to a mainstream reserve asset.
Conor McGregor’s proposal for an Irish Bitcoin strategic reserve highlights the growing interest in Bitcoin as a national reserve asset. If implemented, this proposal could have significant implications for Bitcoin’s adoption and acceptance as a mainstream asset. It could also provide a model for other countries to follow, further increasing the legitimacy and acceptance of Bitcoin.
Conclusion: Navigating the Crypto Seas
As we navigate the crypto seas, it’s essential to keep an eye on the horizon. Bitcoin’s current landscape is a mix of bullish and bearish signals, with technical indicators pointing to short-term strength but long-term uncertainty. The fat-tail phenomenon and decentralization dilemma add layers of complexity to the mix, while the brewing altcoin season and the strategic Bitcoin reserve proposal hint at new opportunities and challenges ahead.
In this ever-changing landscape, one thing is clear: the crypto seas are never calm. But for those willing to navigate the waves, the potential rewards are immense. So, buckle up, keep your eyes on the horizon, and may the crypto winds be ever in your favor.