


Bitcoin’s Wild Ride: Where Could It Be Headed Next?
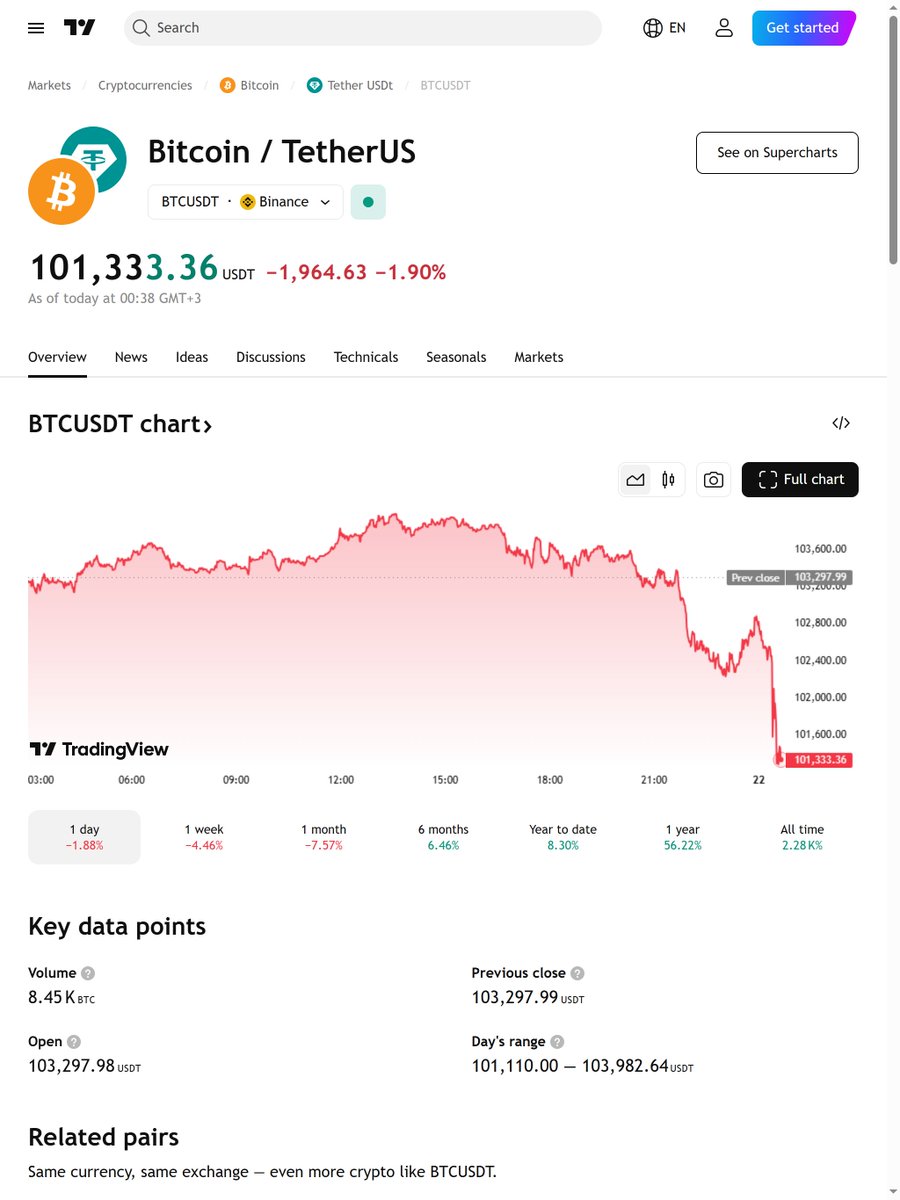
Bitcoin, the first and most famous cryptocurrency, has been on a rollercoaster ride lately. After reaching its highest price ever, around $109,300, Bitcoin took a sudden dip, losing over 21% of its value and dropping to about $87,534 by late February 2025[3]. This price correction has sparked a lot of talk among experts about where Bitcoin might go next. Let’s explore the current market situation and look at two important charts that might give us some clues.
What’s Happening in the Bitcoin Market Right Now?
Bitcoin’s Price Drop
Bitcoin’s recent price drop has been caused by several things. Some people think it’s because of worries about the global economy and problems between countries. For example, some people are worried about a possible trade war because of the tariffs that President Donald Trump wants to put on certain goods[3]. Also, people have been taking money out of Bitcoin ETFs, which has made the price go down[3].
What Technical Analysts Are Saying
Some people who study the technical aspects of the market think that Bitcoin might be getting ready for another big increase in price, maybe even back up to $100,000. They use something called the Wyckoff reaccumulation model to make this prediction. This model has been right before, like in August 2024 when Bitcoin’s price went up by 40%[3]. But this model also shows that Bitcoin is currently in a “Test” phase, where it’s trying to stay above a certain price level, around $85,950[3].
Where Could Bitcoin Be Headed? Let’s Look at the Charts
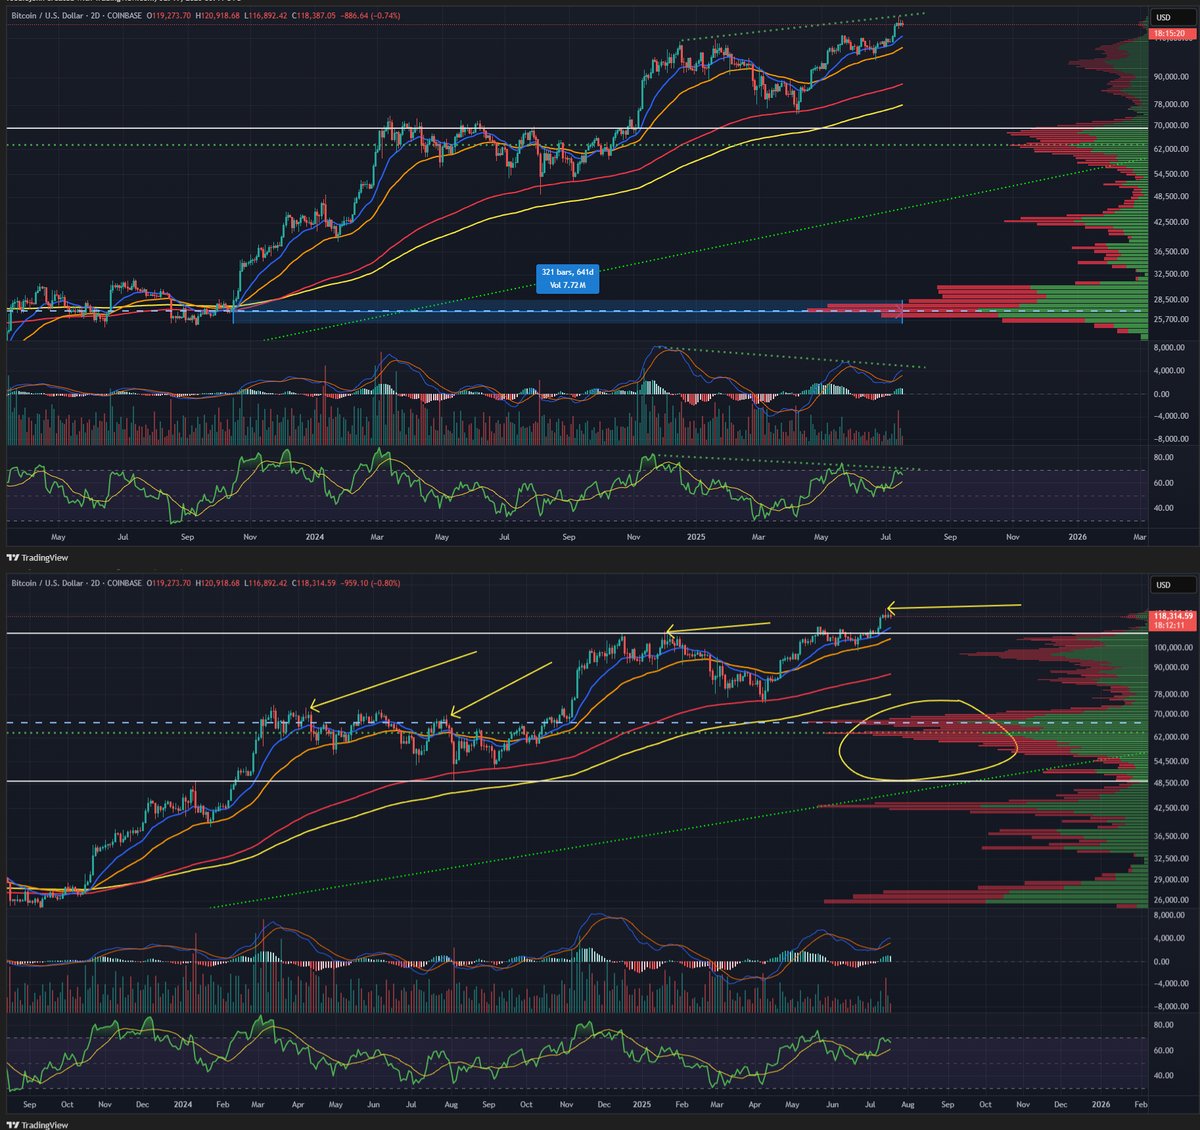
Chart 1: Key Support and Resistance Levels
The first chart shows the most important support and resistance levels for Bitcoin. Right now, Bitcoin is having a hard time staying above the $86,813.41 support level[5]. If it can’t stay above this level, it might drop even lower, maybe even down to the $81,502.03 support level[5]. But if buyers start buying more Bitcoin, it might try to go above the $88,972.37 resistance level, which could mean it’s starting to recover[5].
Chart 2: MACD and RSI Indicators
The second chart shows two important technical tools called the Moving Average Convergence Divergence (MACD) and the Relative Strength Index (RSI). These tools can help us predict what Bitcoin might do in the short term. Recently, we’ve seen something called “death crosses” and “golden crosses” on the MACD line, which means that the price of Bitcoin might go up or down[5]. The RSI has also shown that Bitcoin has been oversold, which sometimes means that the price might go up a little bit[5].
What Does the Future Hold for Bitcoin?
As Bitcoin goes through this tough time, investors and experts are watching closely to see if it starts to recover or if the price goes down even more. The charts suggest that Bitcoin’s immediate future will depend on whether it can stay above certain prices and how it reacts to things happening in the global economy. Only time will tell if Bitcoin will try to reach $100,000 again or if it will have a bigger correction. One thing is for sure: the road ahead will be full of ups and downs!
Sources: CoinCentral, Coinfomania