


The Psychology and Mechanics of Cryptocurrency Trading: A Deep Dive
Introduction: The Emotional Rollercoaster of Crypto
Cryptocurrency trading is not just about numbers and charts—it’s a psychological battleground where fear, greed, and hope collide. The market’s volatility is fueled by human emotion, making it one of the most unpredictable yet fascinating financial arenas. Whether you’re a seasoned trader or a curious observer, understanding the emotional and technical drivers behind crypto movements is crucial.
This report explores the psychological undercurrents, technical analysis trends, and market dynamics shaping the cryptocurrency landscape in 2025. From Polkadot’s price action to Bitcoin’s generational peaks, we’ll dissect the forces at play.
—
The Psychological Drivers of Crypto Markets
Fear, Greed, and Market Sentiment
The cryptocurrency market is heavily influenced by investor sentiment. When fear dominates, prices drop sharply, and when greed takes over, bubbles form. The Greed & Fear Index (a tool measuring market sentiment) often predicts major shifts before they happen. For instance, extreme greed can signal an overbought market, while extreme fear may indicate a buying opportunity.
A tweet from BitcoinWorld Media highlights this psychological tug-of-war, emphasizing that beyond technical indicators, human emotion drives volatility. This emotional volatility explains why traders often experience whipsaws—rapid price swings that test patience and discipline.
The Altcoin Season Dilemma
One recurring frustration in the crypto community is the absence of a sustained altcoin season—a period where alternative cryptocurrencies outperform Bitcoin. A tweet from 2₿LK8 Charts expresses this sentiment, noting that Polkadot (DOT) has been stuck in a holding pattern for days. This stagnation reflects broader market uncertainty, where traders hesitate to commit to altcoins without clear bullish signals.
—
Technical Analysis: The Science Behind the Chaos
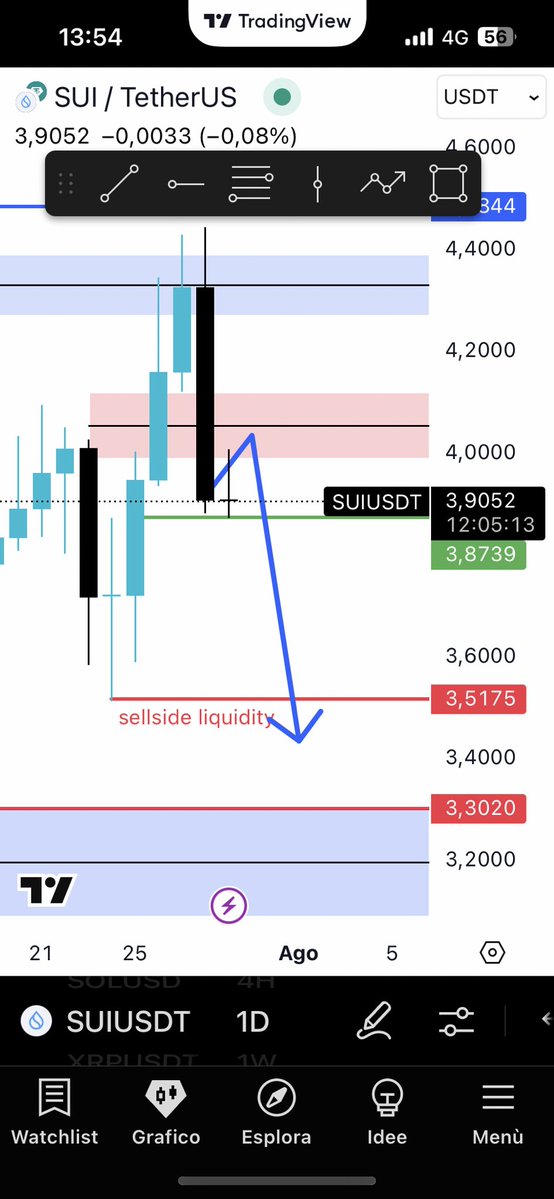
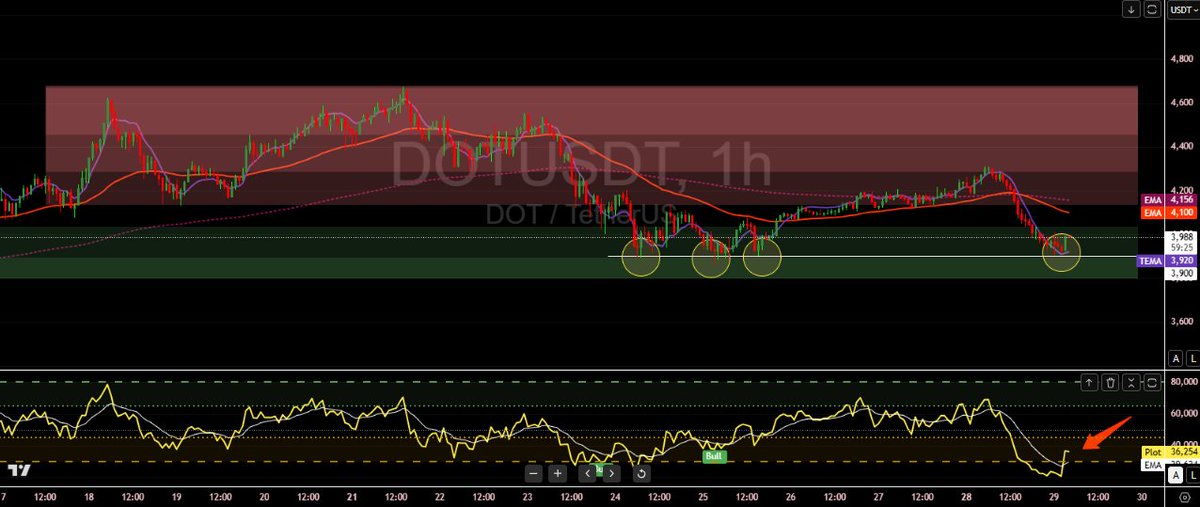
Polkadot’s Stagnation and Potential Breakout
Polkadot (DOT) has been consolidating for nearly a week, a pattern that could signal either a breakout or a prolonged sideways movement. Technical analysts often look for key levels—such as support and resistance zones—to predict future price action. If DOT breaks above its current resistance, it could trigger a rally. However, if it fails to hold support, a deeper correction may follow.
Bitcoin’s Fibonacci and MACD Confluence
A tweet from Tambay Trader highlights Bitcoin’s technical setup, noting a confluence of factors:
– A breakout at the 0.618 Fibonacci retracement level
– A MACD crossover above the zero line (bullish signal)
– RSI crossing the 50 level (neutral to bullish momentum)
These indicators suggest Bitcoin may be gearing up for a move, but traders must remain cautious, as false breakouts are common in crypto.
The “Dome of Doom” Hypothesis
A controversial but intriguing theory gaining traction is the “Dome of Doom” hypothesis, which suggests Bitcoin may be approaching a generational peak. Dr. Martin Hiesboeck explores this idea, questioning whether the current cycle’s highs could mark the end of a major bull run. If true, this would have profound implications for altcoins and the broader market.
—
Market Dynamics: Institutional Adoption and Global Shifts
Coinbase’s Expansion into India
Coinbase’s planned acquisition of CoinDCX, a hacked Indian crypto exchange, signals growing institutional interest in emerging markets. With 7% of Indian citizens already holding cryptocurrency, this move could accelerate adoption in one of the world’s largest economies.
BlackRock’s Bullish Stance on Bitcoin
BlackRock, the world’s largest asset manager, has been vocal about Bitcoin’s role in central bank reserves. A tweet from Robin Gubson highlights this shift, noting that institutions are increasingly viewing Bitcoin as a hedge against dollar dominance. This institutional backing could provide long-term stability to the crypto market.
—
The Future of Crypto Analysis: AI and Machine Learning
BitQuant and OpenGradient’s Data-Driven Approach
The future of crypto trading lies in machine learning and AI-driven analysis. Platforms like BitQuant use predictive algorithms to identify trends, while OpenGradient ensures transparency in decentralized data analysis. These tools help traders make more informed decisions, reducing reliance on emotional impulses.
The Rise of On-Chain Analysis
On-chain metrics—such as exchange inflows, whale movements, and network activity—are becoming essential for traders. Tools like Chainalysis provide deep insights into market behavior, helping analysts predict price movements with greater accuracy.
—
Conclusion: Navigating the Crypto Maze
The cryptocurrency market remains a complex interplay of psychology, technical analysis, and macroeconomic forces. While emotional trading can lead to costly mistakes, disciplined analysis—combined with AI-driven insights—can provide a competitive edge.
As we move forward, institutional adoption, regulatory clarity, and technological advancements will shape the next phase of crypto evolution. Whether Bitcoin is nearing a peak or altcoins are poised for a breakout, one thing is certain: the market will keep evolving, and those who adapt will thrive.
—
Sources