


The Cryptocurrency Frontier
In the fast-paced world of digital currencies, Bitcoin stands as the undisputed pioneer, captivating the imagination of investors and analysts worldwide. As of June 17, 2025, Bitcoin is traversing a landscape filled with technical indicators and market sentiments that create a multifaceted picture. Let’s explore the current state of Bitcoin, delving into the technical analyses and market dynamics that are shaping its future.
The Technical Landscape
Consolidation and Support Levels
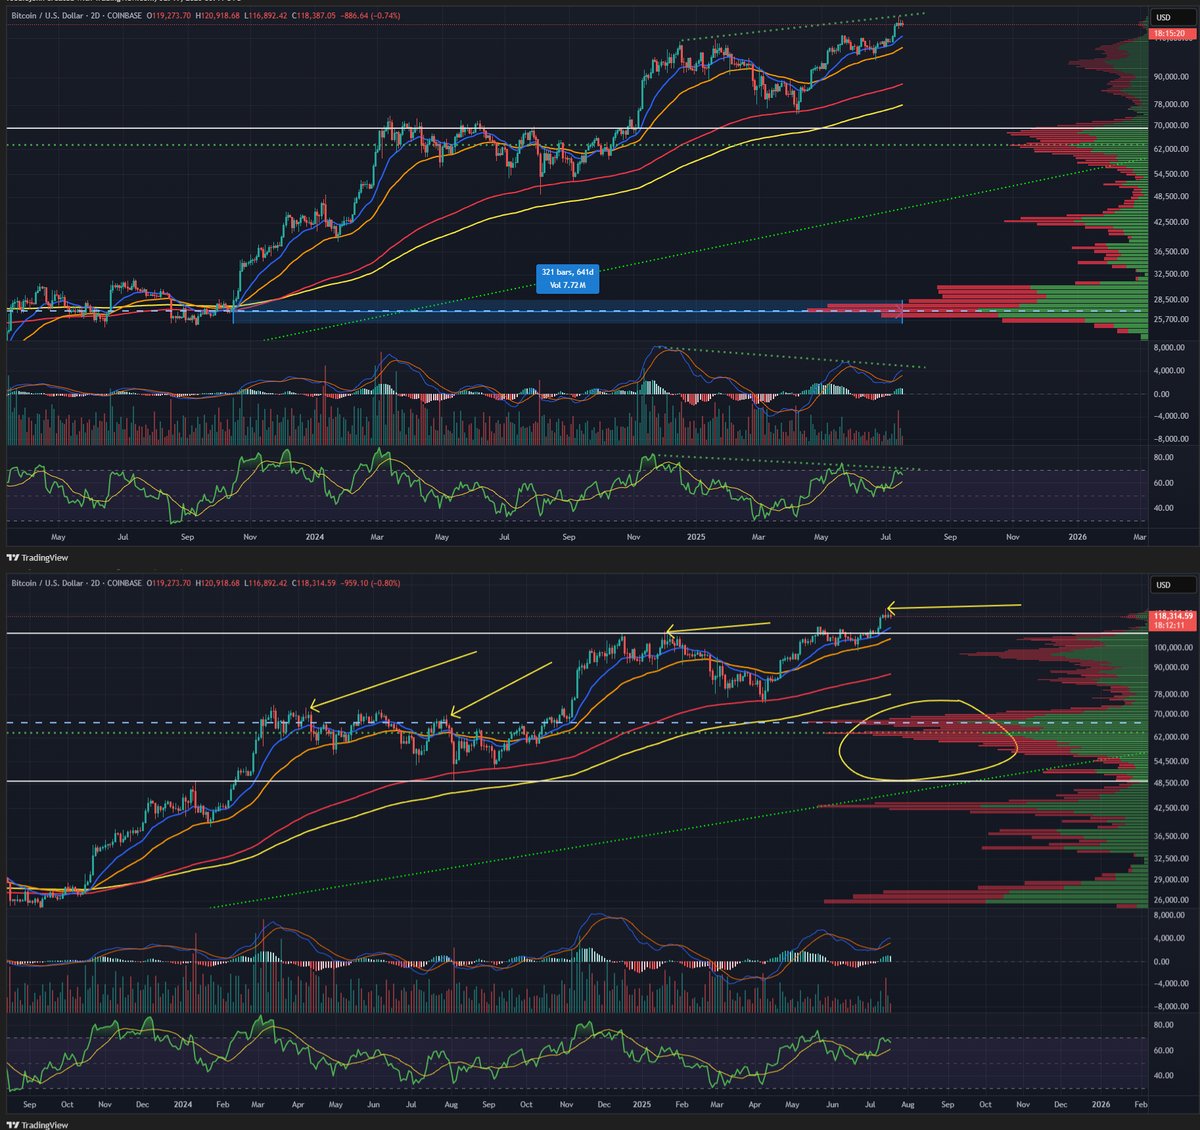
Bitcoin is currently consolidating within an ascending triangle pattern. This pattern is defined by a horizontal resistance level and an upward sloping support trendline. The price is trading above both the support trendline and the Ichimoku Cloud, which is providing additional support. This consolidation phase is pivotal as it sets the stage for the next directional move. A breakout above the resistance level could signal a bullish trend, while a breakdown below the support trendline could indicate a bearish reversal.
Short-Term Bearish Momentum
On shorter timeframes, the momentum indicators are suggesting a bearish outlook. The Moving Average Convergence Divergence (MACD) shows a bearish crossover on the 5-minute chart, indicating short-term selling pressure. Similarly, the Relative Strength Index (RSI) is oversold on the 1-hour and 6-hour charts, suggesting that the price may be due for a bounce. However, the bearish momentum is persistent across multiple timeframes, which could indicate a deeper correction.
Fibonacci Retracement Levels
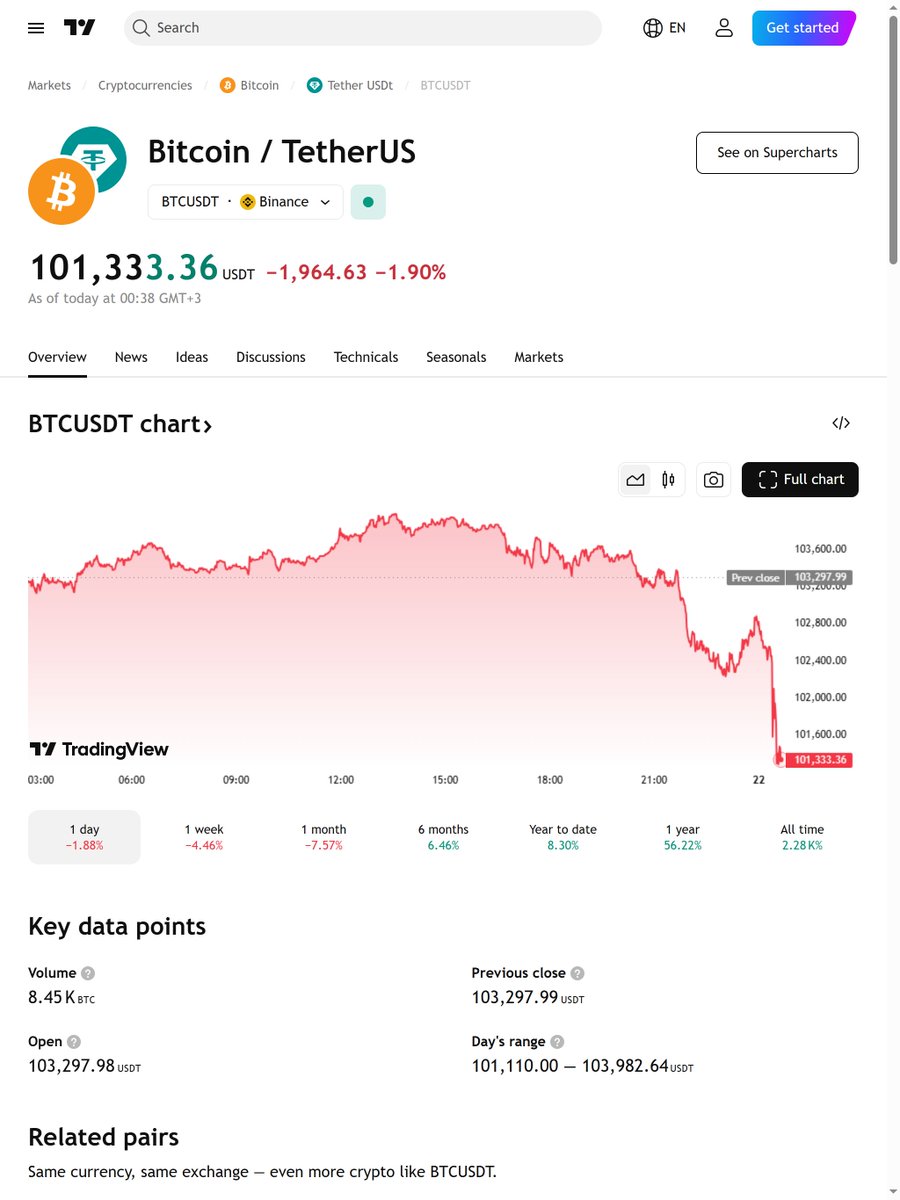
Bitcoin is testing the 0.786 Fibonacci retracement level near $103,000. This level is significant as it often acts as a strong support or resistance zone. If Bitcoin can reclaim the $106,000 level, it has the potential for a bullish breakout toward $117,565. However, a breakdown below $102,703 could negate this setup and lead to further downside movement.
Market Sentiment and External Factors
Institutional Interest
Despite the technical indicators, there is strong institutional interest in Bitcoin. Institutional investors often view Bitcoin as a hedge against inflation and a store of value, similar to gold. This interest can provide a floor for the price, even during periods of technical weakness. The current geopolitical tensions in the Middle East have not significantly impacted Bitcoin’s price action, indicating that institutional investors are maintaining their positions.
Astrological Influences
Some analysts also consider astrological factors in their market analysis. For instance, the Mars/Venus opposition on June 17, 2025, was noted as a potential source of volatility. While astrology is not a traditional tool in financial analysis, it can provide additional insights into market sentiment and potential turning points.
The Road Ahead
Potential Scenarios
Key Levels to Watch
– Support: $102,703, $103,000 (0.786 Fib retracement)
– Resistance: $106,000, $117,565 (bullish target)
– Key Indicators: MACD, RSI, Ichimoku Cloud, Fibonacci retracement levels
Conclusion: Navigating the Uncertainty
Bitcoin’s current technical landscape is a mix of consolidation, bearish momentum, and strong institutional support. As investors navigate this uncertainty, it is crucial to stay informed and adaptable. The next directional move will likely be confirmed by a breakout or breakdown from the ascending triangle pattern. Whether Bitcoin continues its bullish trend or enters a deeper correction, the key levels and indicators discussed will play a pivotal role in shaping its future trajectory. Stay vigilant, stay informed, and most importantly, stay adaptable in the ever-changing world of cryptocurrency.
Sources
Additional Resources
For those interested in diving deeper into the world of Bitcoin and cryptocurrency, consider exploring the following resources:
– CoinMarketCap for real-time market data and analysis.
– CoinDesk for the latest news and insights in the cryptocurrency world.
– Investopedia for educational content on financial markets and cryptocurrencies.