


The Current State of Bitcoin
Imagine standing at the edge of a vast, ever-changing landscape. This is the world of Bitcoin in 2025, a realm shaped by technical intricacies, market emotions, and cutting-edge technology. As of April 13, 2025, Bitcoin is in the midst of a fascinating journey, one that promises both opportunities and challenges. Let’s embark on an exploration of this dynamic landscape, breaking it down into digestible parts to understand where Bitcoin stands and where it might be heading.
Technical Analysis: Patterns and Predictions
Consolidation and Reversal Patterns
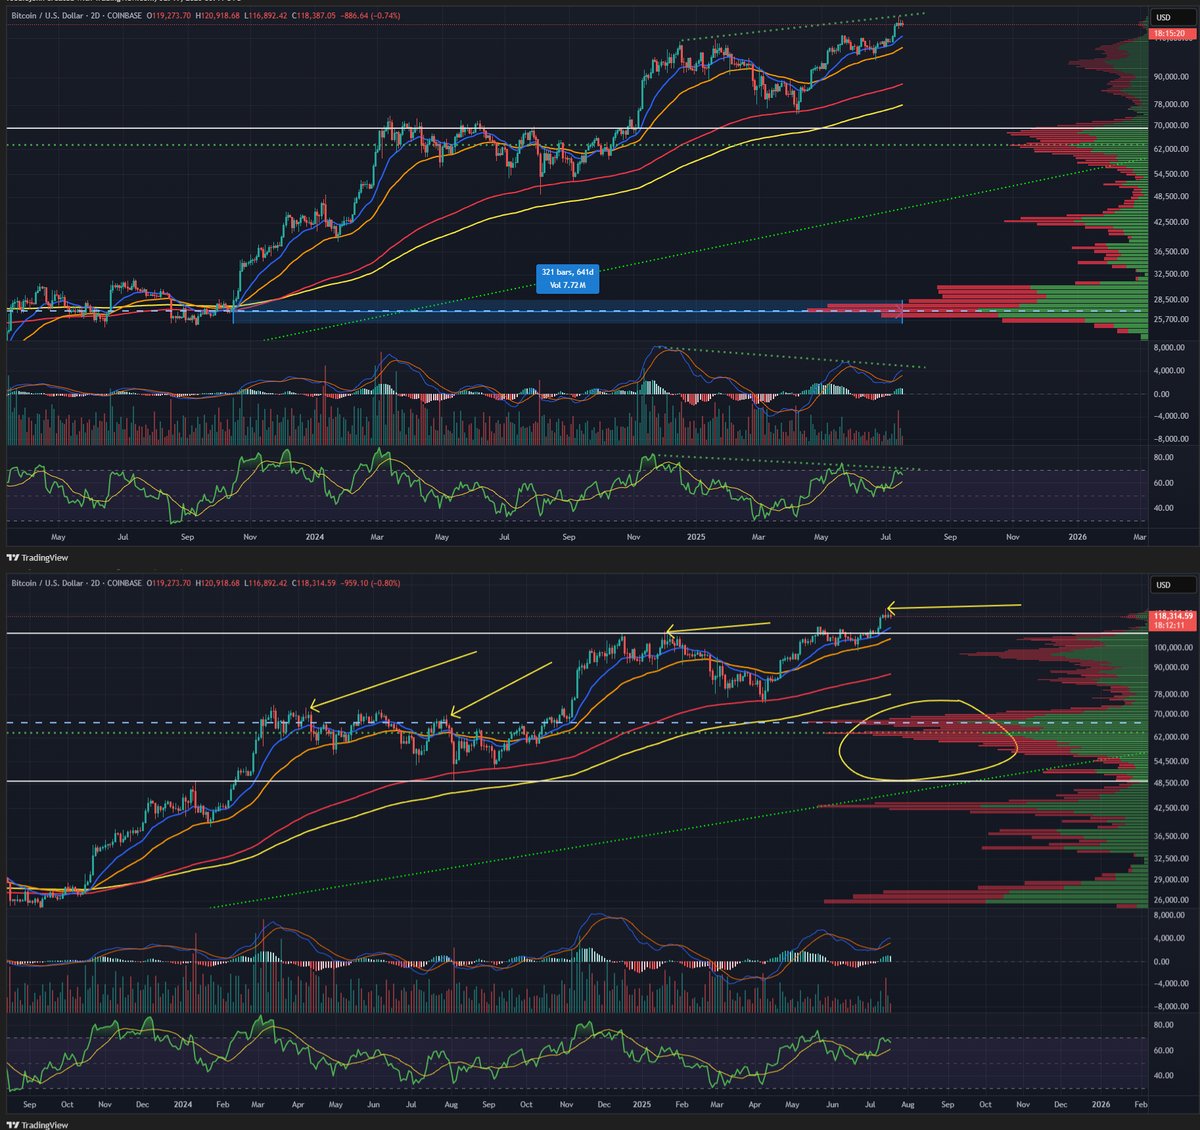
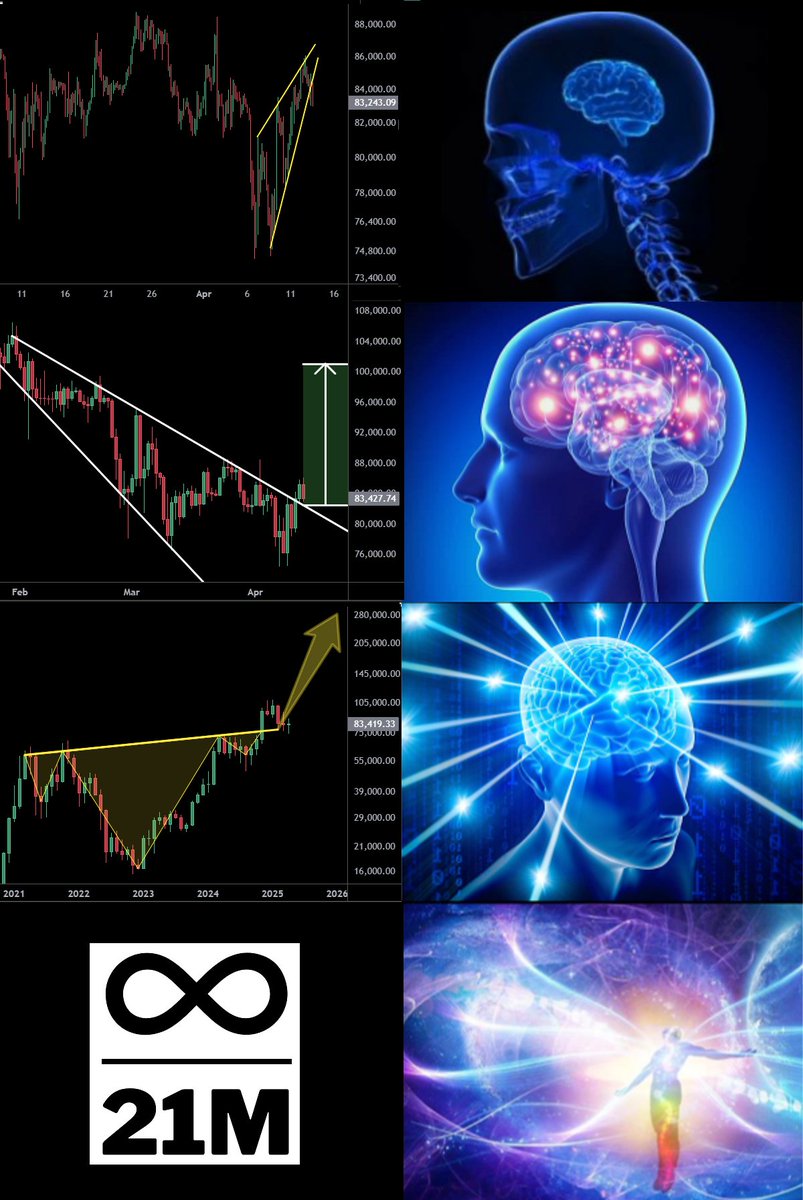
Bitcoin is currently in a phase of consolidation, nestled within a falling wedge pattern. Think of this pattern as a narrowing funnel, where the price of Bitcoin is squeezed between two converging trend lines. This structure often hints at a potential bullish reversal, a moment when the market breathes a sigh of relief and breaks out of its confines. The 50-day moving average (50MA) is acting as a formidable resistance, adding an extra layer of tension to the scenario. It’s like a game of tug-of-war, with buyers and sellers pulling in opposite directions, each hoping to gain the upper hand.
Multi-Timeframe Analysis
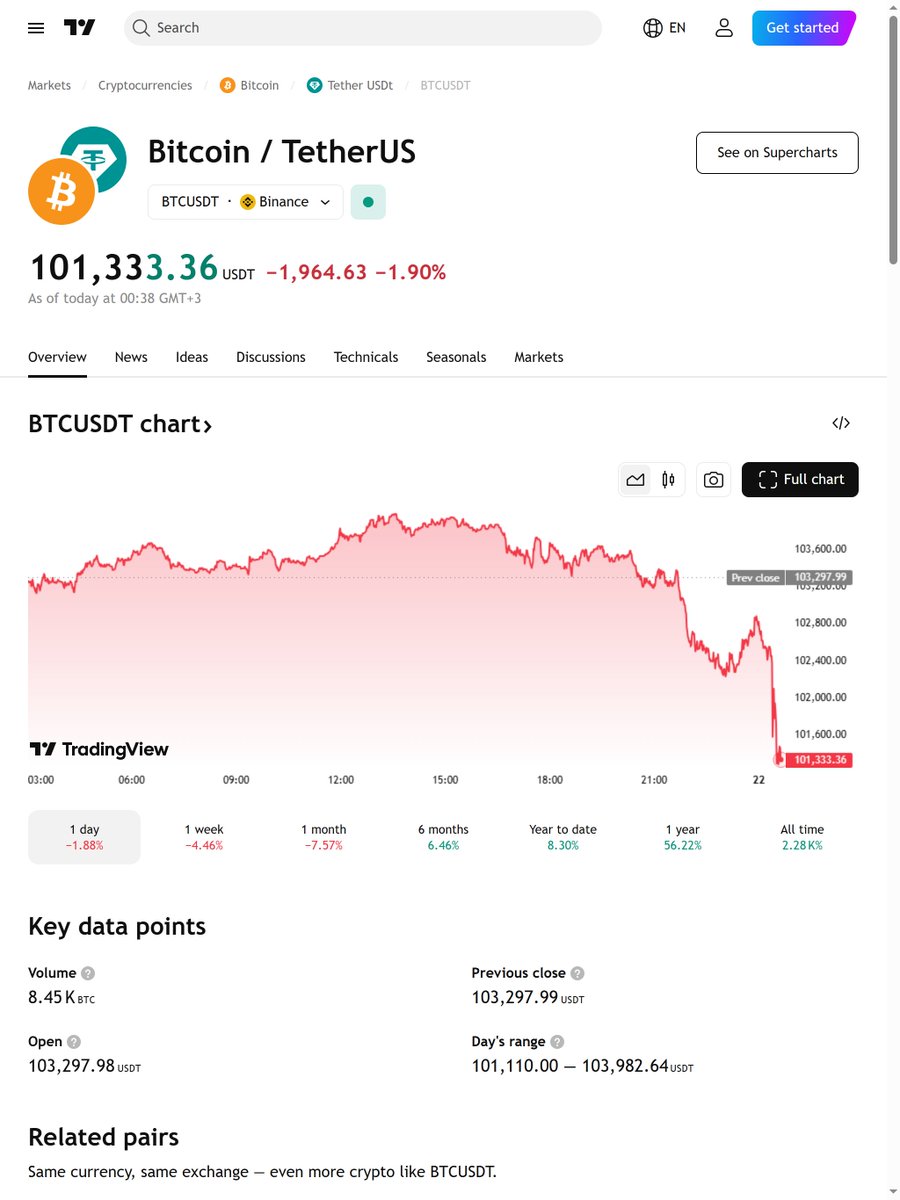
To get a holistic view of Bitcoin’s behavior, it’s essential to zoom in and out, examining different timeframes. On the 1-hour chart, the sentiment is neutral, reflecting short-term indecision. It’s like a calm before the storm, where no one is quite sure which way the wind will blow. However, the 4-hour chart paints a more optimistic picture, predicting a breakout to $95,206 with support at $78,678. This multi-timeframe approach is like having a bird’s-eye view and a close-up lens simultaneously, helping traders spot both short-term trading opportunities and long-term investment strategies.
Market Sentiment: FOMO and Fear
The Fear of Missing Out (FOMO)
Market sentiment is a powerful force, often driving Bitcoin’s price movements more than technical indicators. The Fear of Missing Out (FOMO) is a psychological phenomenon that pushes investors to buy during bullish trends, fearing they might miss out on potential gains. Analysts are keeping a close eye on the FOMO index to gauge market enthusiasm and detect overbought conditions. Understanding where you stand on the FOMO chart can provide valuable insights into the market’s emotional state and potential reversals. It’s like having a pulse on the market’s collective psyche.
Historical Cycles and Seasonality
History has a way of repeating itself, and Bitcoin’s price movements are no exception. By comparing price curves from previous years, we can uncover intriguing patterns. Bitcoin tends to trend upwards between July and November, a seasonal trend that suggests the current period could be ripe for growth. However, it’s crucial to consider both bullish and bearish scenarios, much like a weather forecast that prepares you for both sunshine and rain. This historical context provides a roadmap for navigating the market’s ups and downs.
Technological Advancements: Layer 2 and Beyond
Bitcoin Layer 2 Solutions
Bitcoin’s technological ecosystem is evolving at a rapid pace, with Layer 2 solutions leading the charge. These innovations aim to enhance scalability, reduce transaction costs, and improve overall network efficiency. Imagine a highway with multiple lanes, allowing more cars to travel smoothly and quickly. That’s essentially what Layer 2 solutions do for Bitcoin’s network. Discussions around these advancements have sparked excitement, with industry leaders like Vitalik Buterin sharing insights on the ethical implications and potential of blockchain technology. The development of stablecoins outpacing traditional payment systems like Visa underscores the transformative potential of these innovations.
Distributed Financial Analysis (DFA)
The introduction of the Distributed Financial Analysis (DFA) module by CB Pro adds another layer of sophistication to Bitcoin’s analysis. This module tracks market bets for each cryptocurrency in the top 250 ranked by market capitalization, using Coingecko as a reference. It’s like having a crystal ball that provides real-time data and insights, enabling traders to make more informed decisions in the dynamic cryptocurrency market. Such tools are invaluable for navigating the complexities of the financial landscape.
Conclusion: Navigating the Bitcoin Landscape
Bitcoin’s 2025 landscape is a tapestry woven with technical patterns, market sentiment, and technological innovations. The falling wedge pattern and multi-timeframe analysis offer clues to potential price movements, while market sentiment indicators like FOMO and historical cycles provide context for understanding investor behavior. Technological advancements, particularly in Layer 2 solutions and distributed financial analysis, are set to revolutionize the financial landscape.
As we navigate this complex terrain, it’s crucial to stay informed and adaptable. Whether you’re a short-term trader or a long-term investor, understanding the multi-dimensional aspects of Bitcoin will be key to success. So, where do you stand on the chart? Are you ready to ride the wave of potential growth, or are you preparing for a pause? The choice is yours, but the journey is sure to be exhilarating. Embrace the adventure, and remember, in the world of Bitcoin, every day brings new opportunities and challenges.
Sources
Bitcoin multi-timeframe analysis
Tactical analysis of Bitcoin FOMO
Bitcoin Layer 2’s latest discussions
BTC/USDT falling wedge pattern
Neutral sentiment on BTC/USDT 1-hour chart
Long prediction on BTC/USD 4-hour chart