“`markdown
The Power of Long-Term Perspective
In the fast-paced world of financial markets, where traders often focus on minute-by-minute fluctuations, the monthly chart can seem like a relic from a bygone era. However, seasoned investors know that the monthly chart is a powerful tool that provides a long-term perspective, helping to filter out the noise and focus on the bigger picture. This article delves into the importance of monthly charts, the role of moving averages, and how historical data can guide future investments.
Understanding Monthly Charts
A Bird’s-Eye View
Monthly charts plot the price action of an asset over a month, providing a comprehensive view of its performance over an extended period. This bird’s-eye view is crucial for identifying long-term trends, cycles, and patterns that might not be apparent on shorter timeframes. By zooming out, investors can gain a better understanding of the asset’s behavior and make more informed decisions. For example, a monthly chart of the S&P 500 index can reveal long-term trends that have persisted over decades, such as the bull market of the 1980s and 1990s or the bear market of the early 2000s.
The Role of Moving Averages
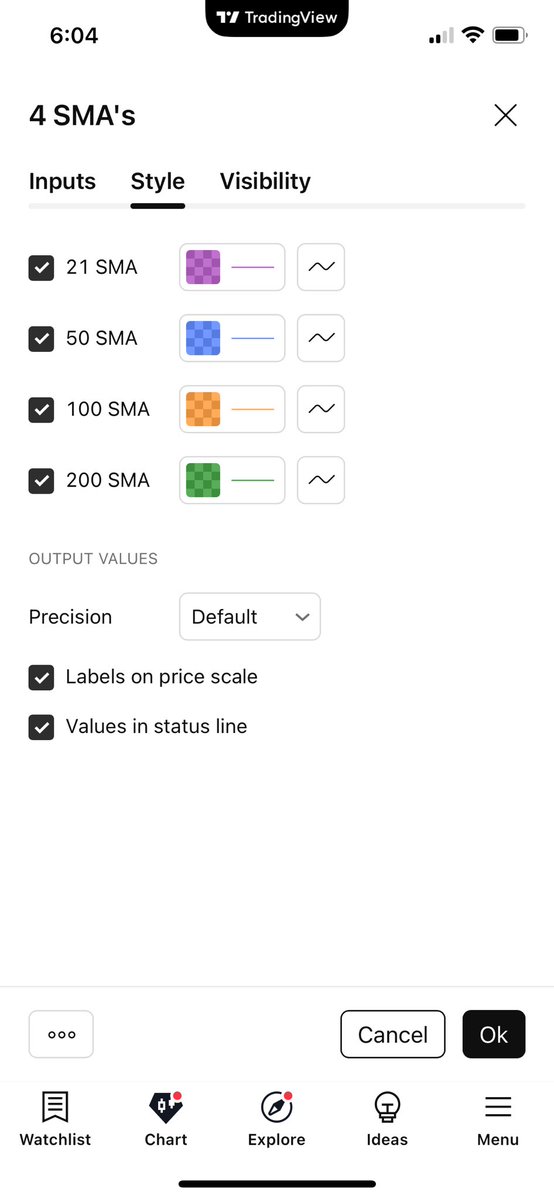
Moving averages are essential tools in technical analysis, smoothing out price data to form a trend-following indicator. On a monthly chart, moving averages can help identify the direction of the trend and potential support or resistance levels. The 50-month simple moving average (SMA), 100-month SMA, and 200-month SMA are particularly significant, as they represent key levels that can influence market psychology and price action. These moving averages act as dynamic support and resistance levels, helping traders to identify potential entry and exit points.
The Importance of Historical Data
Learning from the Past
History has a way of repeating itself in the financial markets. By studying historical data, investors can identify patterns and trends that may recur in the future. This is particularly true for monthly charts, which provide a long-term context for understanding market cycles and trends. For instance, the 2008 financial crisis and the subsequent recovery can be analyzed using monthly charts to understand how markets behaved during such turbulent times. By following history, investors can anticipate potential market movements and position themselves accordingly.
The Wisdom of Crowds
Market sentiment and psychology play a significant role in price action. When a large number of investors focus on key levels, such as the 50-month, 100-month, and 200-month SMAs, these levels can become self-fulfilling prophecies. In other words, the collective expectations of market participants can influence price action, making these levels important to monitor. For example, if a significant number of traders believe that the 200-month SMA will act as a strong support level, the market may react accordingly, reinforcing the importance of this level.
Practical Applications
Trend Identification
One of the primary uses of monthly charts is trend identification. By plotting the price action over an extended period, investors can determine whether an asset is in an uptrend, downtrend, or ranging market. This information is crucial for developing a trading strategy that aligns with the prevailing trend. For example, if a monthly chart shows a clear uptrend in a stock, investors might consider buying on dips rather than selling.
Support and Resistance Levels
Monthly charts can also help identify key support and resistance levels. These levels represent areas where the price has historically struggled to break through or has found support. By monitoring these levels, investors can anticipate potential reversals or breakouts and adjust their positions accordingly. For instance, if a stock has repeatedly found support at a certain price level on a monthly chart, traders might consider buying near this level in anticipation of a bounce.
Risk Management
Monthly charts can aid in risk management by providing a long-term context for setting stop-loss orders and position sizing. By understanding the bigger picture, investors can make more informed decisions about where to place their stop-loss orders and how much capital to allocate to a particular trade. For example, if a monthly chart shows that a stock has a history of significant volatility, traders might set wider stop-loss orders to avoid being stopped out by minor fluctuations.
The Art of Patience
Ignoring the Noise
In the age of high-frequency trading and algorithmic strategies, it’s easy to get caught up in the noise of short-term price fluctuations. Monthly charts remind investors to focus on the bigger picture and ignore the daily ups and downs. This long-term perspective can help investors avoid impulsive decisions and stick to their trading plan. For instance, during periods of high market volatility, traders might be tempted to make frequent trades based on short-term movements. However, a monthly chart can provide a more stable view, helping traders to stay disciplined.
The Value of Discipline
Following a disciplined approach to investing is crucial for long-term success. Monthly charts can help investors maintain discipline by providing a clear, long-term view of the market. By focusing on the bigger picture, investors can avoid the temptation to overtrade or chase short-term gains. For example, a disciplined investor might use a monthly chart to identify a long-term trend and then stick to a predefined trading strategy, rather than making impulsive trades based on short-term market movements.
Conclusion: Embracing the Long-Term View
In a world where instant gratification is the norm, the monthly chart offers a refreshing reminder of the value of patience and discipline. By embracing the long-term view, investors can filter out the noise, identify key trends and patterns, and make more informed decisions. Whether you’re a seasoned investor or just starting, the monthly chart is an essential tool for navigating the complex world of financial markets. So, take a step back, zoom out, and follow history—your future self will thank you.
Sources
“`


