


Mastering Crypto Markets: The Power of Technical Analysis
Introduction
Imagine you’re in a bustling marketplace, filled with chatter and activity. You see merchants haggling, customers browsing, and goods changing hands. Now, picture yourself as a trader in this market, but instead of goods, you’re trading digital assets like Bitcoin or Ethereum. How do you make sense of this chaos? How do you decide when to buy or sell? This is where technical analysis comes in. Let’s explore this powerful tool, using insights from two experienced crypto traders, @kingtee_rex and @pixelden_crypto.
Understanding Technical Analysis
What is Technical Analysis?
Think of technical analysis as a language that helps you understand the market’s ‘body language’. It’s a method of evaluating securities by analyzing statistics generated by market activity, such as past prices and volume. It’s based on the idea that historical price and volume data can predict future price movements. In other words, it helps you read the market’s ‘chatter’ and make informed trading decisions.
Why Use Technical Analysis in Crypto?
Cryptocurrencies, with their volatile nature and 24/7 markets, are perfect for technical analysis. It helps traders:
Charts: The Canvas of Technical Analysis
Types of Charts
Candlestick, bar, and line charts are common in crypto. Each has its strengths, but candlesticks are popular due to their ability to show price action, volume, and sentiment at a glance. They’re like little ‘crowd’ indicators, showing you the market’s mood.
Key Chart Components
– Support and Resistance Levels: These are like the market’s ‘gatekeepers’. Prices often struggle to break through these levels, creating opportunities for traders. For example, if a coin’s price keeps bouncing off a certain level (support), it might be a good time to buy.
– Trendlines: These are like the market’s ‘pathways’. By connecting two or more highs (resistance) or lows (support), you can identify trends. If the price keeps following a certain path, it’s likely to continue doing so.
– Indicators: These are like the market’s ‘whispers’. They’re mathematical calculations based on price and/or volume data, like Moving Averages (MAs) and Relative Strength Index (RSI). They help you understand the market’s sentiment and predict future price movements.
Analyzing the Tweets
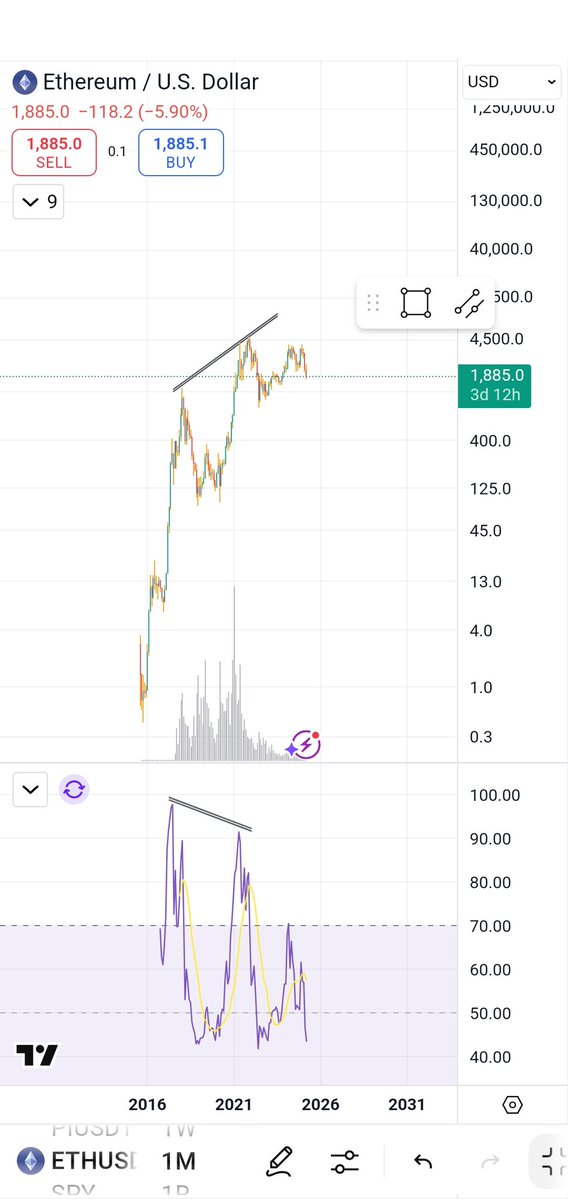
> “Your problem was you didn’t properly analyze your charts. Call me crazy but the moment I noticed this divergence on Ethereum, I knew the coin was going to experience a massive correction. I don’t trade corrections.”
Here, @kingtee_rex highlights the importance of chart analysis. A divergence occurs when the price makes a new high or low, but the indicator (like RSI) doesn’t confirm it. This suggests a potential trend reversal, like a crowd that’s about to change direction. In this case, @kingtee_rex noticed a divergence on Ethereum and predicted a correction.
> “Master the charts, master the market! … Knowledge is power in trading—analyze, strategize, and execute with confidence.”
@pixelden_crypto emphasizes the power of chart mastery. Just like knowing the market’s layout and the crowd’s behavior gives you an edge, understanding the market’s ‘language’ gives you confidence in your trading decisions. It’s about analyzing the market’s behavior, strategizing based on that, and executing with confidence.
Practical Tips for Crypto Traders
1. Keep it Simple
Start with basic indicators like MAs and RSI. Don’t try to use every indicator under the sun. Keep your analysis simple and easy to understand.
2. Use Multiple Timeframes
Analyze charts on different timeframes (e.g., daily, 4-hour, 1-hour) to gain a broader perspective. This is like watching the crowd from different angles. You might see something different from above than you would from the middle of the crowd.
3. Combine Technicals with Fundamentals
News and project developments can drive price action. Consider both when making decisions. It’s like watching the crowd and also listening to the merchants’ chatter.
4. Backtest and Practice
Use historical data to test your strategies. Paper trading can help you gain experience without risking real capital. It’s like practicing your trading ‘language’ before diving into the market.
Conclusion: The Power of Mastery
Mastering technical analysis is like learning a new language. It takes time, practice, and patience. But once you’re fluent, you’ll gain a powerful tool for navigating the crypto markets. You’ll be able to read the market’s ‘chatter’, predict its movements, and make informed trading decisions. So, grab your charts, start analyzing, and let the market’s ‘language’ become your secret weapon.
Sources
[1] Investopedia: Technical Analysis
[2] Coinbase: Crypto Chart Basics
[4] @kingtee_rex – Twitter
[5] @pixelden_crypto – Twitter