


Crypto Chart Analysis: A Tale of Two Coins
Introduction
Imagine you’re navigating a vast, uncharted ocean. You have a map, but it’s not just any map; it’s a dynamic one, constantly changing with the tides and currents. This is the world of cryptocurrency, and your map is the chart. To trade successfully, you must learn to read it. Let’s explore two tweets from March 28, 2025, and use Ethereum as our case study to understand the language of the markets.
The Power of Divergence
Understanding Divergence
Divergence is a powerful tool in technical analysis, akin to a lighthouse warning of impending storms. It occurs when the price of an asset moves in the opposite direction of an indicator, such as the Relative Strength Index (RSI) or Moving Averages (MA). In simple terms, it’s like a tug-of-war where one team (the price) is pulling stronger than the other (the indicator), suggesting a potential trend reversal.
Michael Adonri’s Insight
Michael Adonri, a.k.a. @kingtee_rex, spotted a bullish divergence on Ethereum’s chart. He didn’t trade corrections, but his tweet serves as a reminder of the importance of spotting these signals [1].
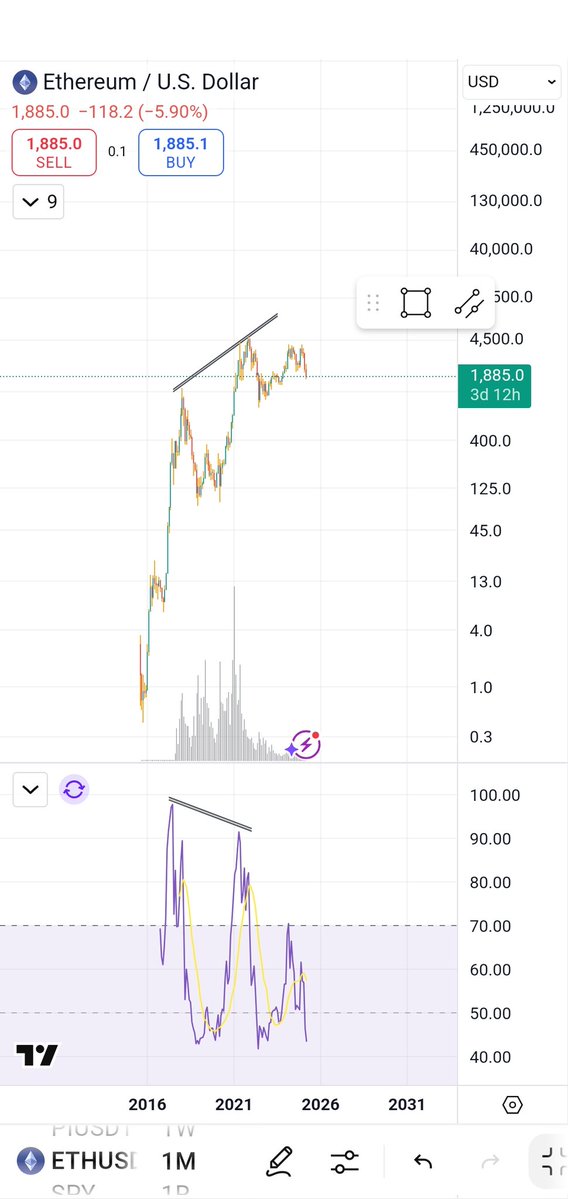
*Figure 1: Ethereum Divergence (Source: TradingView)*
In Figure 1, notice how Ethereum’s price (blue line) was making higher highs, while the RSI (orange line) was making lower highs. This is a bullish divergence, suggesting that the buyers were losing momentum, setting the stage for a potential pullback.
Mastering the Charts
The Importance of Analysis
Pixel Den, @pixelden_crypto, stresses the significance of chart analysis. It’s not just about spotting patterns; it’s about understanding the story behind the lines [2].
*Figure 2: Ethereum Chart (Source: TradingView)*
Figure 2 tells a story. The various indicators and patterns are like chapters in a book. Each one provides a piece of the puzzle, and it’s up to you to put them together to form a coherent narrative.
Strategize and Execute
Analyzing charts is just the first step in a three-part process. Once you’ve identified a potential trend or reversal, it’s time to strategize. This could involve:
– Setting stop-loss orders to manage risk
– Deciding on position size based on your risk tolerance
– Waiting for confirmation signals, such as a break of a support or resistance level
Execution is the final step. It’s about turning your analysis into action. This is where discipline comes into play. Stick to your strategy, and don’t let emotions cloud your judgment. Remember, the market doesn’t care about your feelings; it only responds to your actions.
Conclusion: Chart Analysis in 2025
The Future of Trading
In 2025, chart analysis is more than just an advantage; it’s a necessity. With the rise of algorithmic trading and high-frequency trading, understanding charts is not just about spotting trends; it’s about understanding the present and making informed decisions.
But remember, chart analysis is not about predicting the future. It’s about understanding the present and using that knowledge to your advantage. It’s about spotting trends, identifying patterns, and using that knowledge to make strategic decisions.
So, whether you’re a seasoned trader or just starting out, master the charts, and you’ll be one step closer to mastering the market.
Sources
Further Reading
– Investopedia’s Guide to Technical Analysis
– TradingView’s Learning Center
– CryptoQuant’s Blog