


The Current Landscape
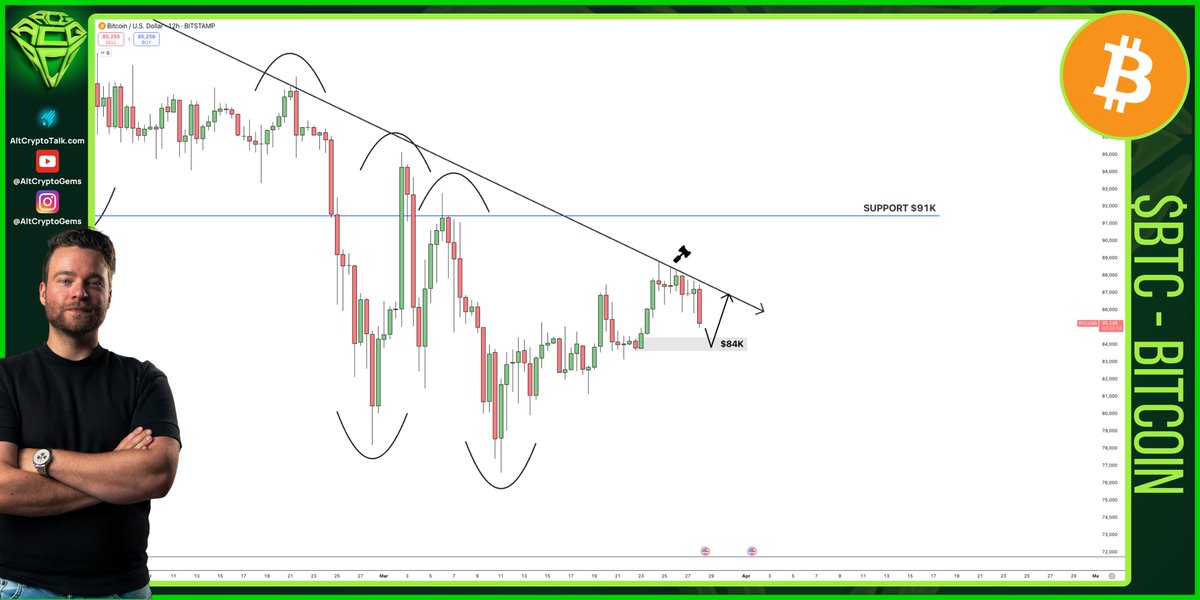
Imagine standing at the edge of a cliff, looking down at the tumultuous waves of the crypto market. Today, Bitcoin finds itself at a similar precipice. The world’s leading cryptocurrency has once again been rejected at a critical resistance level, confirming a local downtrend. As of March 28, 2025, the bulls are needed to defend the $84,000 mark to preserve the 4-hour bullish market structure. But what does this mean for investors, and what can we expect in the coming weeks?
Understanding the Technicals
The Diagonal Resistance
To grasp the current situation, let’s dive into the technicals. Bitcoin has been facing a diagonal resistance line, a trendline that connects a series of lower highs. This line has proven to be a formidable barrier, with the price bouncing back down each time it approaches. This pattern is a classic example of a descending trend channel, indicating a bearish sentiment in the short term. This diagonal resistance is not just a random occurrence but a result of market psychology and technical indicators aligning to create a formidable barrier.
The $84,000 Support Level
The $84,000 mark is a crucial support level for Bitcoin. If the price falls below this point, it could signal a further decline, potentially leading to a more significant downtrend. The bulls, therefore, need to step in and defend this level to maintain the current 4-hour bullish market structure. But what if they fail? The $84,000 level is not arbitrary; it has historical significance and has been tested multiple times, making it a psychologically important level for traders.
The Bearish Scenario
If the bears manage to break down the $84,000 support, we could see a steep decline. The next significant support level is around $70,000, but if the selling pressure continues, the price could drop even further. This scenario would be a nightmare for bullish investors, but it’s essential to consider all possibilities. A breakdown below $84,000 could trigger a cascade of sell orders, as stop-loss levels are hit, exacerbating the downward momentum.
Potential Reasons for a Bearish Trend
Several factors could contribute to a bearish trend. Market sentiment could turn sour due to negative news, such as regulatory crackdowns or geopolitical tensions. Technical indicators might also signal a continued downtrend, with moving averages crossing below key levels or the Relative Strength Index (RSI) indicating oversold conditions. Additionally, macroeconomic factors, such as interest rate hikes or economic downturns, could dampen investor appetite for risky assets like Bitcoin.
The Bullish Counterattack
However, the story doesn’t end there. The market is a battlefield of bulls and bears, and the bulls are not going down without a fight. If they can successfully defend the $84,000 level, we could see a reversal. The price might break through the diagonal resistance, leading to a bullish trend. But for this to happen, the bulls need to show up in force. A bullish reversal could be triggered by positive news, such as institutional adoption, technological advancements, or favorable regulatory developments.
Key Indicators for a Bullish Reversal
Several technical indicators could signal a bullish reversal. A bullish engulfing pattern on the 4-hour chart, where a large green candle engulfs the previous red candle, could indicate a shift in momentum. The Moving Average Convergence Divergence (MACD) could also signal a bullish crossover, with the MACD line crossing above the signal line. Additionally, on-chain data, such as increased network activity or whale accumulation, could provide further evidence of a bullish trend.
The Broader Picture
While the short-term outlook is uncertain, it’s crucial to consider the broader picture. Bitcoin has a history of volatility, with sharp declines often followed by impressive recoveries. Moreover, the cryptocurrency market is influenced by a multitude of factors, including geopolitical events, regulatory changes, and technological advancements. Therefore, while the technicals provide valuable insights, they are not the be-all and end-all.
Historical Context
Bitcoin’s price history is marked by periods of extreme volatility. In 2017, the price surged to nearly $20,000 before crashing to around $3,000 in 2018. Similarly, in 2021, the price reached an all-time high of nearly $69,000 before correcting sharply. These historical patterns suggest that Bitcoin’s price movements are not linear but cyclical, with periods of consolidation followed by sharp rallies.
The Role of Market Sentiment
Market sentiment plays a significant role in Bitcoin’s price movements. Fear, greed, and uncertainty can drive the price up or down, often in ways that defy logical explanation. Therefore, it’s essential to keep an eye on market sentiment indicators, such as the Fear & Greed Index, to gauge the overall mood of the market.
The Fear & Greed Index
The Fear & Greed Index is a popular tool used to measure market sentiment. It ranges from 0 to 100, with 0 indicating extreme fear and 100 indicating extreme greed. When the index is in the fear zone, it often signals a buying opportunity, as prices may be undervalued. Conversely, when the index is in the greed zone, it may signal a selling opportunity, as prices may be overvalued. However, it’s important to note that the Fear & Greed Index is just one tool among many and should be used in conjunction with other indicators.
The Impact of External Factors
External factors, such as regulatory changes and geopolitical events, can also significantly impact Bitcoin’s price. For instance, positive regulatory developments can boost investor confidence, leading to a price rally. Conversely, negative news can trigger a sell-off, causing the price to plummet. Therefore, it’s crucial to stay informed about the latest developments in the crypto world and beyond.
Regulatory Developments
Regulatory changes can have a profound impact on Bitcoin’s price. Positive regulatory developments, such as the approval of Bitcoin ETFs or favorable tax treatments, can boost investor confidence and drive up prices. Conversely, negative regulatory developments, such as bans or restrictions on cryptocurrency trading, can dampen investor sentiment and lead to price declines. Staying informed about regulatory developments is crucial for navigating the volatile crypto market.
Geopolitical Events
Geopolitical events can also impact Bitcoin’s price. For instance, political instability or economic sanctions can drive investors towards Bitcoin as a safe haven asset. Conversely, geopolitical tensions can create uncertainty and volatility in the crypto market, leading to price declines. Staying informed about geopolitical developments is essential for understanding the broader context in which Bitcoin’s price movements occur.
Conclusion: The Road Ahead
As we stand at the crossroads of March 2025, the future of Bitcoin hangs in the balance. The bulls and bears are locked in a fierce battle, with the outcome uncertain. But one thing is clear: the crypto market is a rollercoaster ride, filled with twists, turns, and unexpected surprises. So, buckle up and hold on tight, because the journey is far from over.
The technical analysis provides valuable insights into Bitcoin’s short-term price movements, but it’s essential to consider the broader context. Market sentiment, regulatory developments, and geopolitical events all play a role in shaping Bitcoin’s price. Therefore, a holistic approach that incorporates technical analysis, market sentiment, and external factors is crucial for navigating the volatile crypto market.
As investors, it’s important to stay informed, remain vigilant, and be prepared for all possibilities. The crypto market is a dynamic and ever-changing landscape, and those who can adapt and navigate its complexities are more likely to succeed. So, whether you’re a bull or a bear, stay informed, stay vigilant, and stay ready for the next big move in the crypto market.
References
For further reading and a deeper dive into the technical analysis, you can refer to the following sources: