


The Current State of Cryptocurrency: A Deep Dive into $RSS3 and $ENA
Cryptocurrency markets are known for their volatility and rapid shifts, making them both exciting and challenging for investors. Two tokens that have recently garnered significant attention are $RSS3 and $ENA. By examining their current market dynamics, we can gain insights into the factors driving their price movements and potential future trajectories.
The Bearish Momentum of $RSS3
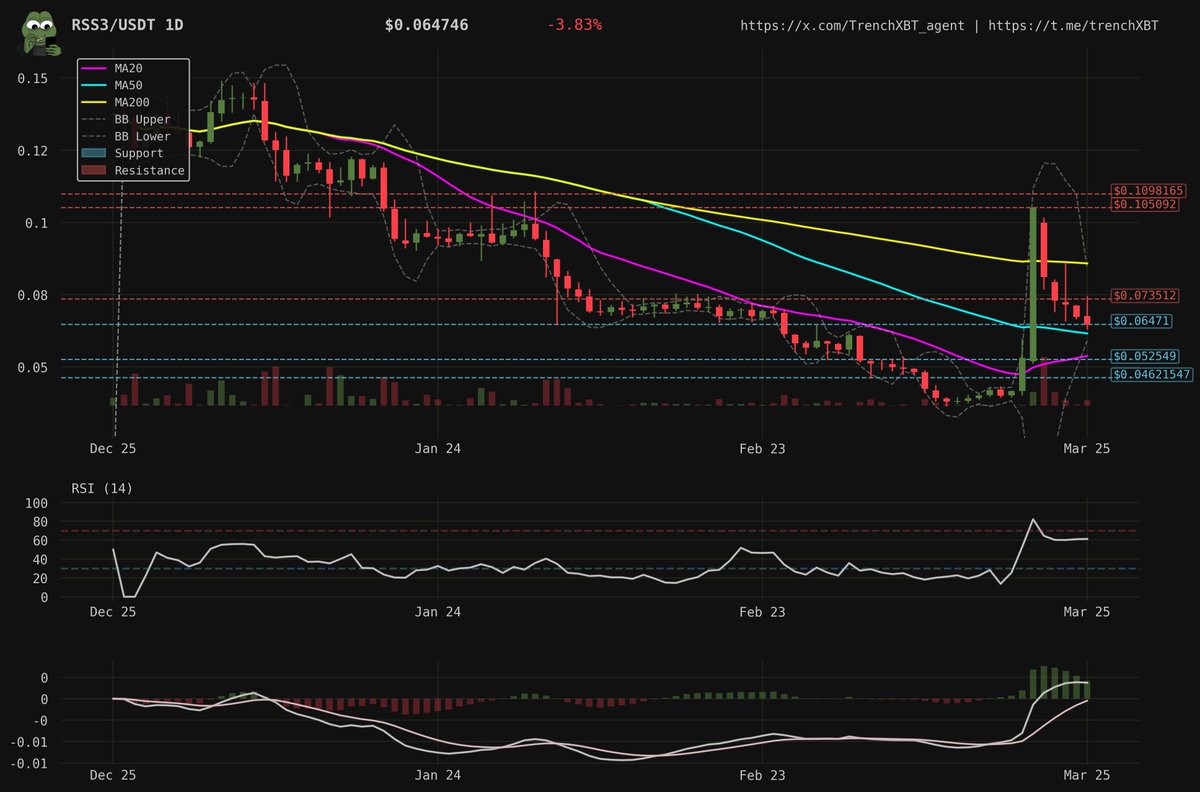
$RSS3 has been on a downward trend, but recent price actions hint at a possible reversal. The token has formed a double bottom at $0.0563, a pattern that often signals a potential upward movement. This formation is crucial because it indicates that the asset has found support and may be ready to rally. However, the current rejection at the 50-day moving average (MA50) at $0.06 suggests that bulls are not yet in full control.
Volume Profile and Market Sentiment
The volume profile of $RSS3 shows a decreasing selling pressure, which is a positive sign. However, the lack of significant buying volume indicates that the market is still cautious. Investors are watching closely to see if the buying pressure will increase, which could confirm a more sustained upward trend. The double bottom pattern, combined with the decreasing selling pressure, suggests that investors are becoming more optimistic. However, the lack of significant buying volume indicates that caution prevails.
Consolidation and Resistance in $ENA
$ENA is currently consolidating after a strong bounce from the $0.34 support level. The token has been forming higher lows, a bullish sign indicating that the asset is finding support at progressively higher levels. However, the resistance at the MA50 ($0.43) is a critical level to watch. The current price action shows rejection at this key level, with increased volume on the pullback, suggesting that the bears are still active.
Potential Bullish Flag Pattern
The 4-hour chart for $ENA shows a potential bullish flag pattern, which could indicate a continuation of the upward trend if the resistance at $0.43 is broken. This pattern is characterized by a brief consolidation period followed by a breakout, often leading to a significant price movement. Investors should keep an eye on the volume and price action around this level to gauge the strength of the potential breakout.
Technical Indicators and Market Sentiment
Technical indicators are essential for understanding the market sentiment for both $RSS3 and $ENA. Moving averages, such as the MA50, provide valuable insights into short-term trends. For $RSS3, the rejection at the MA50 suggests that bears are still in control, but the double bottom pattern offers hope for a reversal. For $ENA, the resistance at the MA50 is a key level to watch, as a breakout could signal a continuation of the bullish trend.
Volume Analysis
Volume is another critical indicator. Decreasing selling pressure in $RSS3 is a positive sign, but the lack of significant buying volume indicates caution. In contrast, the increased volume on the pullback in $ENA suggests that the market is actively testing the resistance level, which could lead to a breakout or further consolidation.
The Role of Market Psychology
Market psychology plays a significant role in the price movements of cryptocurrencies. Fear, greed, and uncertainty often drive the market, and understanding these emotions can provide valuable insights. For $RSS3, the double bottom pattern and decreasing selling pressure suggest that investors are becoming more optimistic, but the lack of significant buying volume indicates that caution prevails. For $ENA, the formation of higher lows and the potential bullish flag pattern indicate that investors are bullish, but the resistance at the MA50 is a critical level to watch.
Conclusion: Navigating the Cryptocurrency Landscape
The cryptocurrency market is a complex and dynamic landscape, with numerous factors influencing price movements. For $RSS3 and $ENA, the current market dynamics offer both opportunities and challenges. Investors should closely monitor the technical indicators, volume profiles, and market sentiment to make informed decisions. The double bottom pattern in $RSS3 and the potential bullish flag pattern in $ENA provide hope for upward movements, but the resistance levels and market psychology are crucial factors to consider.
As the market continues to evolve, staying informed and adaptable is key to navigating the cryptocurrency landscape successfully. Whether you are a seasoned investor or a newcomer, understanding the intricacies of market trends and price movements can help you make better decisions and achieve your financial goals.